What can Open Data do? Anything!
OpenLitterMap.com empowers anyone to map and share data on plastic pollution anywhere.
Not only is OpenLitterMap data mapped, but more importantly, anyone can download all of the data for free, and use it, for any purpose, without permission.
We call this free and unrestricted right to access data “Open Data” as the data is free to download and comes with complete freedom of use. The only restriction with what open data can be used for is someone’s imagination. Even in this crazy technological boom-time and rapid global awareness of the destruction of plastic in the environment, litter mapping is a new field of Citizen Science that remains largely unexplored, and will continue to remain largely unexplored when access to data is restricted. Open data is necessary to advance and democratize science. Open data also puts citizens, researchers, governments and corporations on an equal playing field. In this post I will give some examples of what open data can be used for. If you want to invent some other use case, create your own maps, charts, open source tools, websites, apps, open data empowers and allows you to do that.
This blog post is by no means a conclusive study. I’m just going to experiment and share some ideas.
If you visit OpenLitterMap.com and log in, click on “World Cup” and every location will have its’ own download option.

Press that big red button, and hey presto — you will download all of the data for Australia- or any location. Easy!
Actually, you don’t even need to log in to access OpenLitterMap data. If you want to download all of the data for Australia, or any location where data exists, all you have to do is finish the URL with /download
The open data is just a CSV dump for now but I do have plans to open up filterable JSON API endpoints and more.
For example, to download all of the data for Australia, simply visit
openlittermap.com/maps/Australia/download
or to download all of the data for the UK, simply visit
openlittermap.com/maps/UK/download
You get the idea.
If the Country data is too much, or if you are too lazy to programatically filter data by location like me, sub-national data is also provided at each State and City too —
openlittermap.com/maps/Australia/NSW/download
openlittermap.com/maps/Australia/NSW/Sydney/download
This syntax works for any location where data exists.
openlittermap.com/maps/UK/England/London/download
As new data is added, these spreadsheets get longer meaning you are getting the oldest data and the top, and the lovely new data is added to the bottom.
For this example, I will experiment with some of the data collected by Skibbereen Tidy Towns, in West Cork, Ireland as they asked me to write this piece. Props to Skib Tidy- who were the first Tidy Towns (cleanup group) in Ireland to get on the Top10 OpenLitterMappers at the LitterWorldCup!

Skibbereen Tidy Towns are currently (23rd Feb 2019) at 7th place with 5,115xp. (1 experience point [xp] is given for every image and every piece of litter)
To access the data they have created, simply visit
openlittermap.com/maps/Ireland/County Cork/West Cork/download
That was pretty easy. Thanks Skib!
Let’s take a look at the open data in Excel.
*drum roll please*
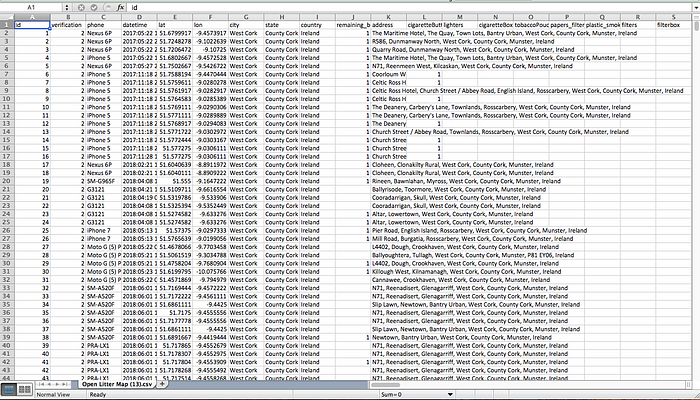
Ta-daa! You just downloaded some free and open data that you can use for any purpose, without permission.
Let me briefly explain these columns. Each row is a photo of litter, with a unique GPS point and timestamp, that may contain 1 or multiple types of litter.
A = Each row has its own index (1,2,3…)
B = A Verification value of 2 means an admin has manually verified the contents of this image to be correct. This should provide some certainty with the data and remove a high degree of ambiguity.
C =What model of phone was used to collect the data. Different types of phones exhibit different spatial accuracies.
D = The exact time the photo was taken, with the Year, Month, Date, Hour, Minute and Second.
E + F = GPS Co-ordinates.
G, H, I = City/Town, State and Country where this data was recorded.
J = Remaining. Is the litter still there, or has it been taken away? This is in beta, because of the complete lack of support available for the development of technology to share data on plastic pollution. Gah.
K = The full OpenStreetMap address at the GPS co-ordinate.
L, onwards. Over 100 pre-defined types of litter and over 60 corporate brands. Notice there are NO HASHTAGS. If you are using hashtags, STOP! Hashtags are error prone, arbitrary, inconsistent, computationally expensive and lack quantification.
For some experimentation, I will be using QGIS (v2.18).
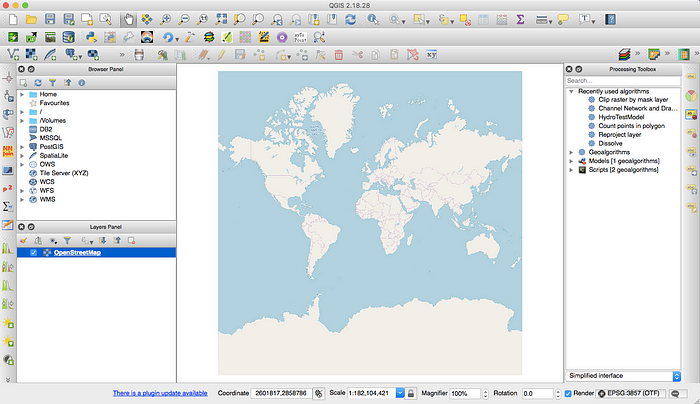
Once you get that installed you should see a blank canvas like this- or else just click on the Blank paper in the upper-left hand corner to create one.

We will use OpenStreetMap as a basemap because its awesome. If you don’t have the plugin installed, install it? I created a shortcut.

Hello, world!
There are a couple of ways to add the OpenLitterMap data. I find the most consistent way is to add a delimited text layer.

Open that up and select your data.

and with the power of QGIS installed on my machine…. presto!

I bind keyboard shortcuts so I can easily zoom in on a layer by its bounding box.
There is all of the OpenLitterMap data for West Cork imported into QGIS. Since the data is open and QGIS is open source, anyone can make plugins to make this process easier. These are some of the many many things on my todo list which is getting longer quicker than I can get things done.

We are interested in the data for Skibbereen town and not the rest of West Cork, so we will perform a geospatial filter. Since I am not sure about the consistency of the address values, I’m going to perform this by hand by drawing a polygon. It also takes about 5 seconds.

You have to love working with QGIS.

Kids learn this stuff in school these days, right?
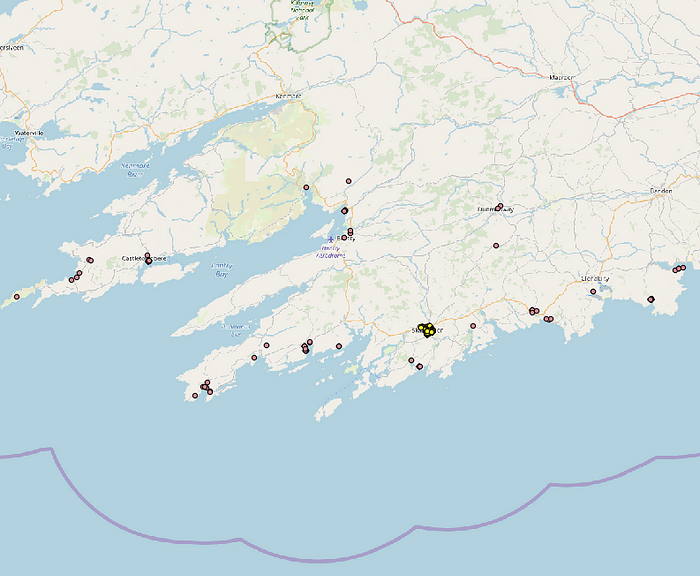
Next, save the selected features as a new layer.


Remember to check this box. Don’t forget to deselect the data you just selected for West Cork. You can deselect or remove the West Cork layer and enable the Skibbereen data and you should get something like this:
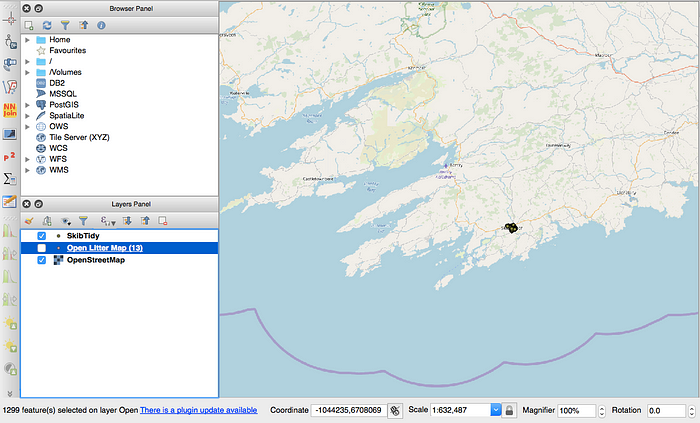
Let’s zoom in and take a look. Remember, do yourself a favour and bind a keyboard shortcut to zoom to the extent of the bounding box so you don’t have to play around for hours with the awful zooming tools.

If you open the attribute table, you can see there are 1299 points here. Each point is a photo that has at least 1 and perhaps multiple types of litter associated with it.
Before we classify the data or perform some analysis, we might want to find out a bit more about the data. Let’s look at some statistics. On QGIS, click the first icon shown here.


Making sure we have the filtered Skib data (not entire West Cork) we can do a quick summary on each column. Of the 1,299 photos, only 9 of them have cigarette butts which is a total of 40 cigarette butts for our dataset. That doesn’t mean there are no cigarette butts in Skibbereen (maybe there isn’t) but perhaps these citizen scientists are less interested in cigarette butts and more interested in bigger pieces of litter? We call this observer bias and that could do with a whole pile of research in itself.
Not too many cigarette butts, but you can cycle through each column pretty quickly. By looking at the Count (frequency) and sum (total aggregated values) you get some indication of the data.

Beer cans….in Ireland? No way.
Cool — well we could probably see where these are ending up.

I extracted some of the alcohol data and classified it, and you can see there is one big outlier (that red dot in the middle, where 100 beer cans were found). OpenLitterMap doesn’t share the photo filepaths yet because I am trying to learn machine learning. If society thought my work was important, I could release them?
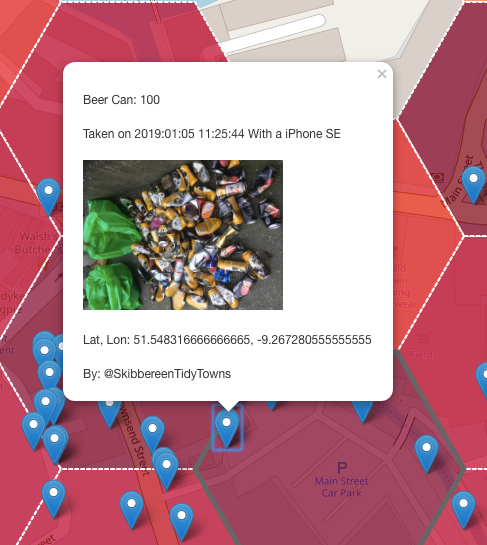
This may have been where a cleanup effort was logged and not necessarily where all these beer cans were found, but it goes to show that a lot of beer cans were found around this area. Maybe this is somewhere a potential bin or recycling / deposit return facility could be located?
There was also alcohol-related litter found at the corner of the playground and along the roads by the church and the south-east residential area. I should also note that this data is not necessarily a complete picture of the litter situation in Skibbereen, and that I’m not taking the time factor into account either. We will be able to get more complete datasets when the apps and smart contracts are released.
I also just noticed that every row doesn’t have a total_litter_count, so I’ll add that in one day but for now if you want that you will have to generate that column manually. I find this is easier to do in Excel than QGIS. Just remember that if you do this in excel, you will want to copy and paste the aggregated values to avoid importing the sum function into QGIS.
The other cool thing is that we are using OpenStreetMap as a basemap. OpenStreetMap is the most comprehensive map of the world ever made by over 2-million people and OpenStreetMap is ….. open data! We can download all that data too, and use it for whatever the hell we want. Nice.


Sweet. So now we have some data on Skibbereen, which may include pubs, coffeeshops, bus stops, bins, and all sorts of other good location information that you can bet your arse we would have a difficult and expensive time getting elsewhere. Could I just take a moment to remind you that Open Data is completely badass? If the data is incomplete, you can just add to it and fix it up and make that data available as open data so anyone else can do research on whatever they want too. Yay science!

The data isn’t complete, which limits what we can do. But the whole point of this tutorial is to share some ideas about what is possible anyway. I looked through the point data and classified some of the more interesting points and gave them some labels. Maybe we can find some relationship between these points and what kind of litter is found?

With the alcohol related litter, there was very little found around the school (de la Salle), the Garda (police) station, or the shop (Spar). That’s probably a good sign. Most of the alcohol related litter was out in the suburbs. Some local knowledge would be useful to help with this interpretation but it’s cool that anyone can participate in this research anywhere in the world without permission.
There’s all sorts of other crap we can do too. This is what a heatmap of the total litter looks like. With the data, we can investigate what kinds of litter are found, where they are found, and what businesses share the responsibility. And most importantly, what can be done about it?
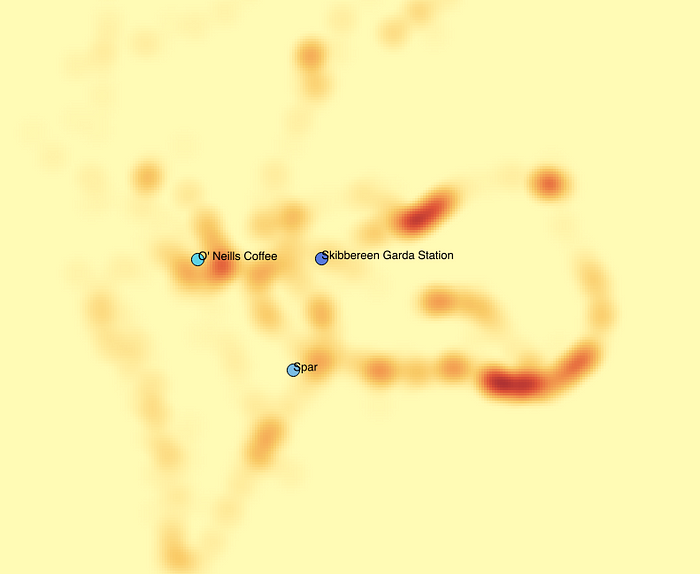
You can also install the MMQGIS plug-in, create a hexagonal grid, and run a count points-in-polygon vector analysis, and then classify the data with some sort of gradient, and maybe remove the empty cells? This is what the new “total litter” column I added looks like.

The good news is that if you can’t be bothered to create these kind of maps, OpenLitterMap just does it for you.

https://openlittermap.com/maps/Ireland/County%20Cork/West%20Cork/map
You can toggle litter by behaviour
And you can change the size of the hex, and filter data by time.
https://openlittermap.com/maps/Ireland/County%20Cork/West%20Cork/options
I have only scratched the surface. I haven’t looked at time series, Veroni analysis, or investigated the relationship between OpenStreetMap and OpenLitterMap in any significant detail, but hopefully this gives you an idea of what can be done by anyone, for free, without permission with open data from OpenLitterMap and OpenStreetMap.
If you like my work, or maybe you think open data is important, please sign up and support me with €5 a month so I can develop this significantly futher?
Happy mapping!
